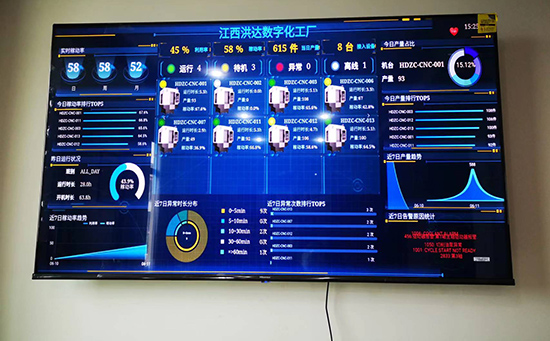
ERP系統 & MES 生產管理系統
10萬用戶實施案例,ERP 系統實現微信、銷售、庫存、生產、財務、人資、辦公等一體化管理
Understanding and Calculating the Average in Excel: A Comprehensive Guide
Calculating averages in Excel is a fundamental task for anyone dealing with data analysis, whether for work, education, or personal projects. Averages provide a concise summary of data sets, helping to identify trends, make predictions, and draw meaningful conclusions. In this guide, we will explore various methods to calculate averages in Excel, from basic formulas to more advanced techniques. By the end, you will be equipped with the knowledge to efficiently compute averages and leverage Excel’s capabilities for your data needs.
1. Basic Average Calculation with the AVERAGE Function
Excel’s AVERAGE function is the simplest way to calculate the average of a range of cells. It computes the arithmetic mean of the values provided. To use the AVERAGE function:
- Enter
=AVERAGE(into the cell where you want the result. - Select the range of cells containing the data.
- Closing parenthesis
)and press Enter.
This function is ideal for straightforward average calculations without additional criteria.
2. Calculating Weighted Averages for Weighted Data
In scenarios where each data point carries a different weight, such as grades or financial data, Excel’s SUMPRODUCT function paired with division provides a solution. Here’s how:
- Use
=SUMPRODUCTto multiply each value by its corresponding weight. - Divide the result by the total weight sum, calculated separately.
This method ensures that data points with greater significance influence the average proportionally more.
3. Handling Averages with Conditions Using AVERAGEIF and AVERAGEIFS
When you need to calculate averages based on specific conditions or criteria, Excel offers AVERAGEIF and AVERAGEIFS functions:
AVERAGEIFcalculates the average of cells that meet a single condition.AVERAGEIFSextends this capability to multiple criteria.
These functions are powerful tools for analyzing data subsets within larger datasets, such as sales figures by region or grades by subject.
4. Dynamic Averages with PivotTables
PivotTables in Excel provide a dynamic way to summarize and analyze data, including calculating averages. Here’s how to use PivotTables for average calculations:
- Create a PivotTable from your dataset.
- Drag the desired field into the Values area and select “Average” as the calculation type.
PivotTables offer flexibility in exploring averages across different dimensions of your data, facilitating deeper insights.
5. Error Handling and Ignoring Non-Numeric Values
When working with datasets that may contain errors or non-numeric entries, ensuring accurate averages is crucial. Excel’s AVERAGEIF combined with ISNUMBER can filter out non-numeric values before averaging:
- Use
AVERAGEIFwithISNUMBERto exclude cells that are not numeric. - This approach prevents errors and ensures calculations are based only on valid data.
6. Advanced Average Calculations with Array Formulas
For complex scenarios requiring more advanced calculations, Excel’s array formulas offer robust solutions. Array formulas can handle multiple conditions and computations within a single formula, including averaging:
- Enter the formula using curly braces to indicate an array operation.
- Array formulas provide immense power but require careful construction to avoid errors.
By mastering array formulas, you can perform intricate average calculations efficiently.
Enhance Your Data Analysis with Excel Averages
Excel’s diverse set of functions and tools for averaging empowers users to derive valuable insights from their data. Whether you are analyzing sales performance, student grades, or scientific measurements, understanding how to calculate averages effectively is essential. By leveraging the methods outlined in this guide—from basic functions to advanced techniques—you can confidently navigate average calculations in Excel, making informed decisions based on accurate data summaries.
Explore Excel’s Averaging Capabilities Further
Excel continues to evolve with each version, introducing new features and enhancing existing functionalities for data analysis. Stay updated with the latest developments to maximize your productivity and analytical capabilities with Excel averages.


 咨詢顧問
咨詢顧問